


Water Resources
Responding to Water Risks
We recognize that our business in India is a business conduct in a water-stressed region.
While India is a high water risk region, at our factory in India, which began operations in 2015, primarily produces molded products such as baby bottles and silicone nipples, actual water consumption is kept at very low level, actually lower than that of any of our own factories. This is because it is not a production activity that utilizes water resources, such as skin care or detergents. At this time, we have not identified any water risks that may affect our business activities or the environment, but we will continue to analyze water risks by obtaining information on the site and water usage.
Total Amount of Water Consumption at Manufacturing Sites
Unit: 1,000m³
|
Dec. 2020 |
|||
|---|---|---|---|
|
Total of all manufacturing sites |
PIGEON INDIA PVT.LTD. (India) Water stressed area*1 |
||
|
Total water withdrawal |
219.2 |
0.9 |
|
|
Surface water |
38.3 |
0.0 |
|
|
Groundwater |
64.6 |
0.9 |
|
|
Seawater |
0.0 |
0.0 |
|
|
Municipal potable water |
116.4 |
0.0 |
|
|
Rainwater |
0.0 |
0.0 |
|
|
Quarry water |
0.0 |
0.0 |
|
|
Withdrawal from other organizations |
0.0 |
0.0 |
|
|
Others |
0.0 |
0.0 |
|
|
Total water discharge |
169.7 |
0.7 |
|
|
|
Surface water |
84.0 |
0.0 |
|
Groundwater |
0.0 |
0.0 |
|
|
Seawater |
0.0 |
0.0 |
|
|
Sewerage |
61.4 |
0.0 |
|
|
Discharge to other organizations |
24.3 |
0.7 |
|
|
Others |
0.0 |
0.0 |
|
|
Total water consumption |
49.6 |
0.2 |
|
* Boundary: All manufacturing sites (sites coverage 100%)
*1 Manufacturing site in water stressed regions: Among 10 manufacturing sites of Pigeon Group, PIGEON INDIA PVT.LTD, is the only facility located in water stressed region, India. The share of PIGEON INDIA for the consolidated sales in 2020 was 0.6% and it mainly produces molded products such as nursing bottles and silicone nipples. Thus, the amounts of water withdrawn and discharge are kept at the lowest among all production sites of Pigeon Group.
Prevent pollution
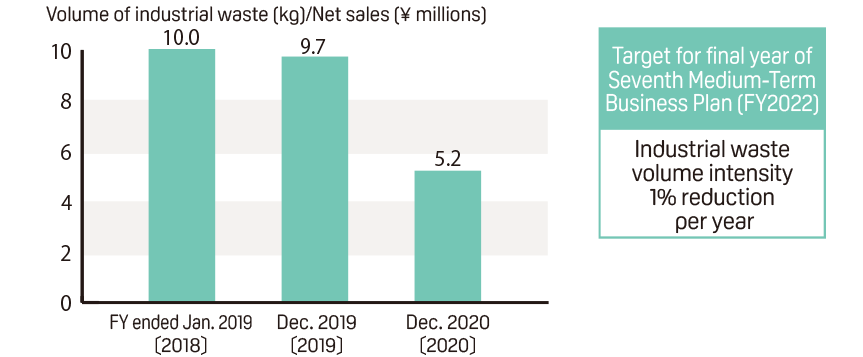
The Pigeon Group is committed to minimizing non-recyclable industrial waste generated by its business activities. Our goal is to reduce the volume of industrial waste per unit of production by 1% per year. We are also working in other ways to prevent pollution at our plants, such as improving productivity and yield and closing waste incinerators.
-
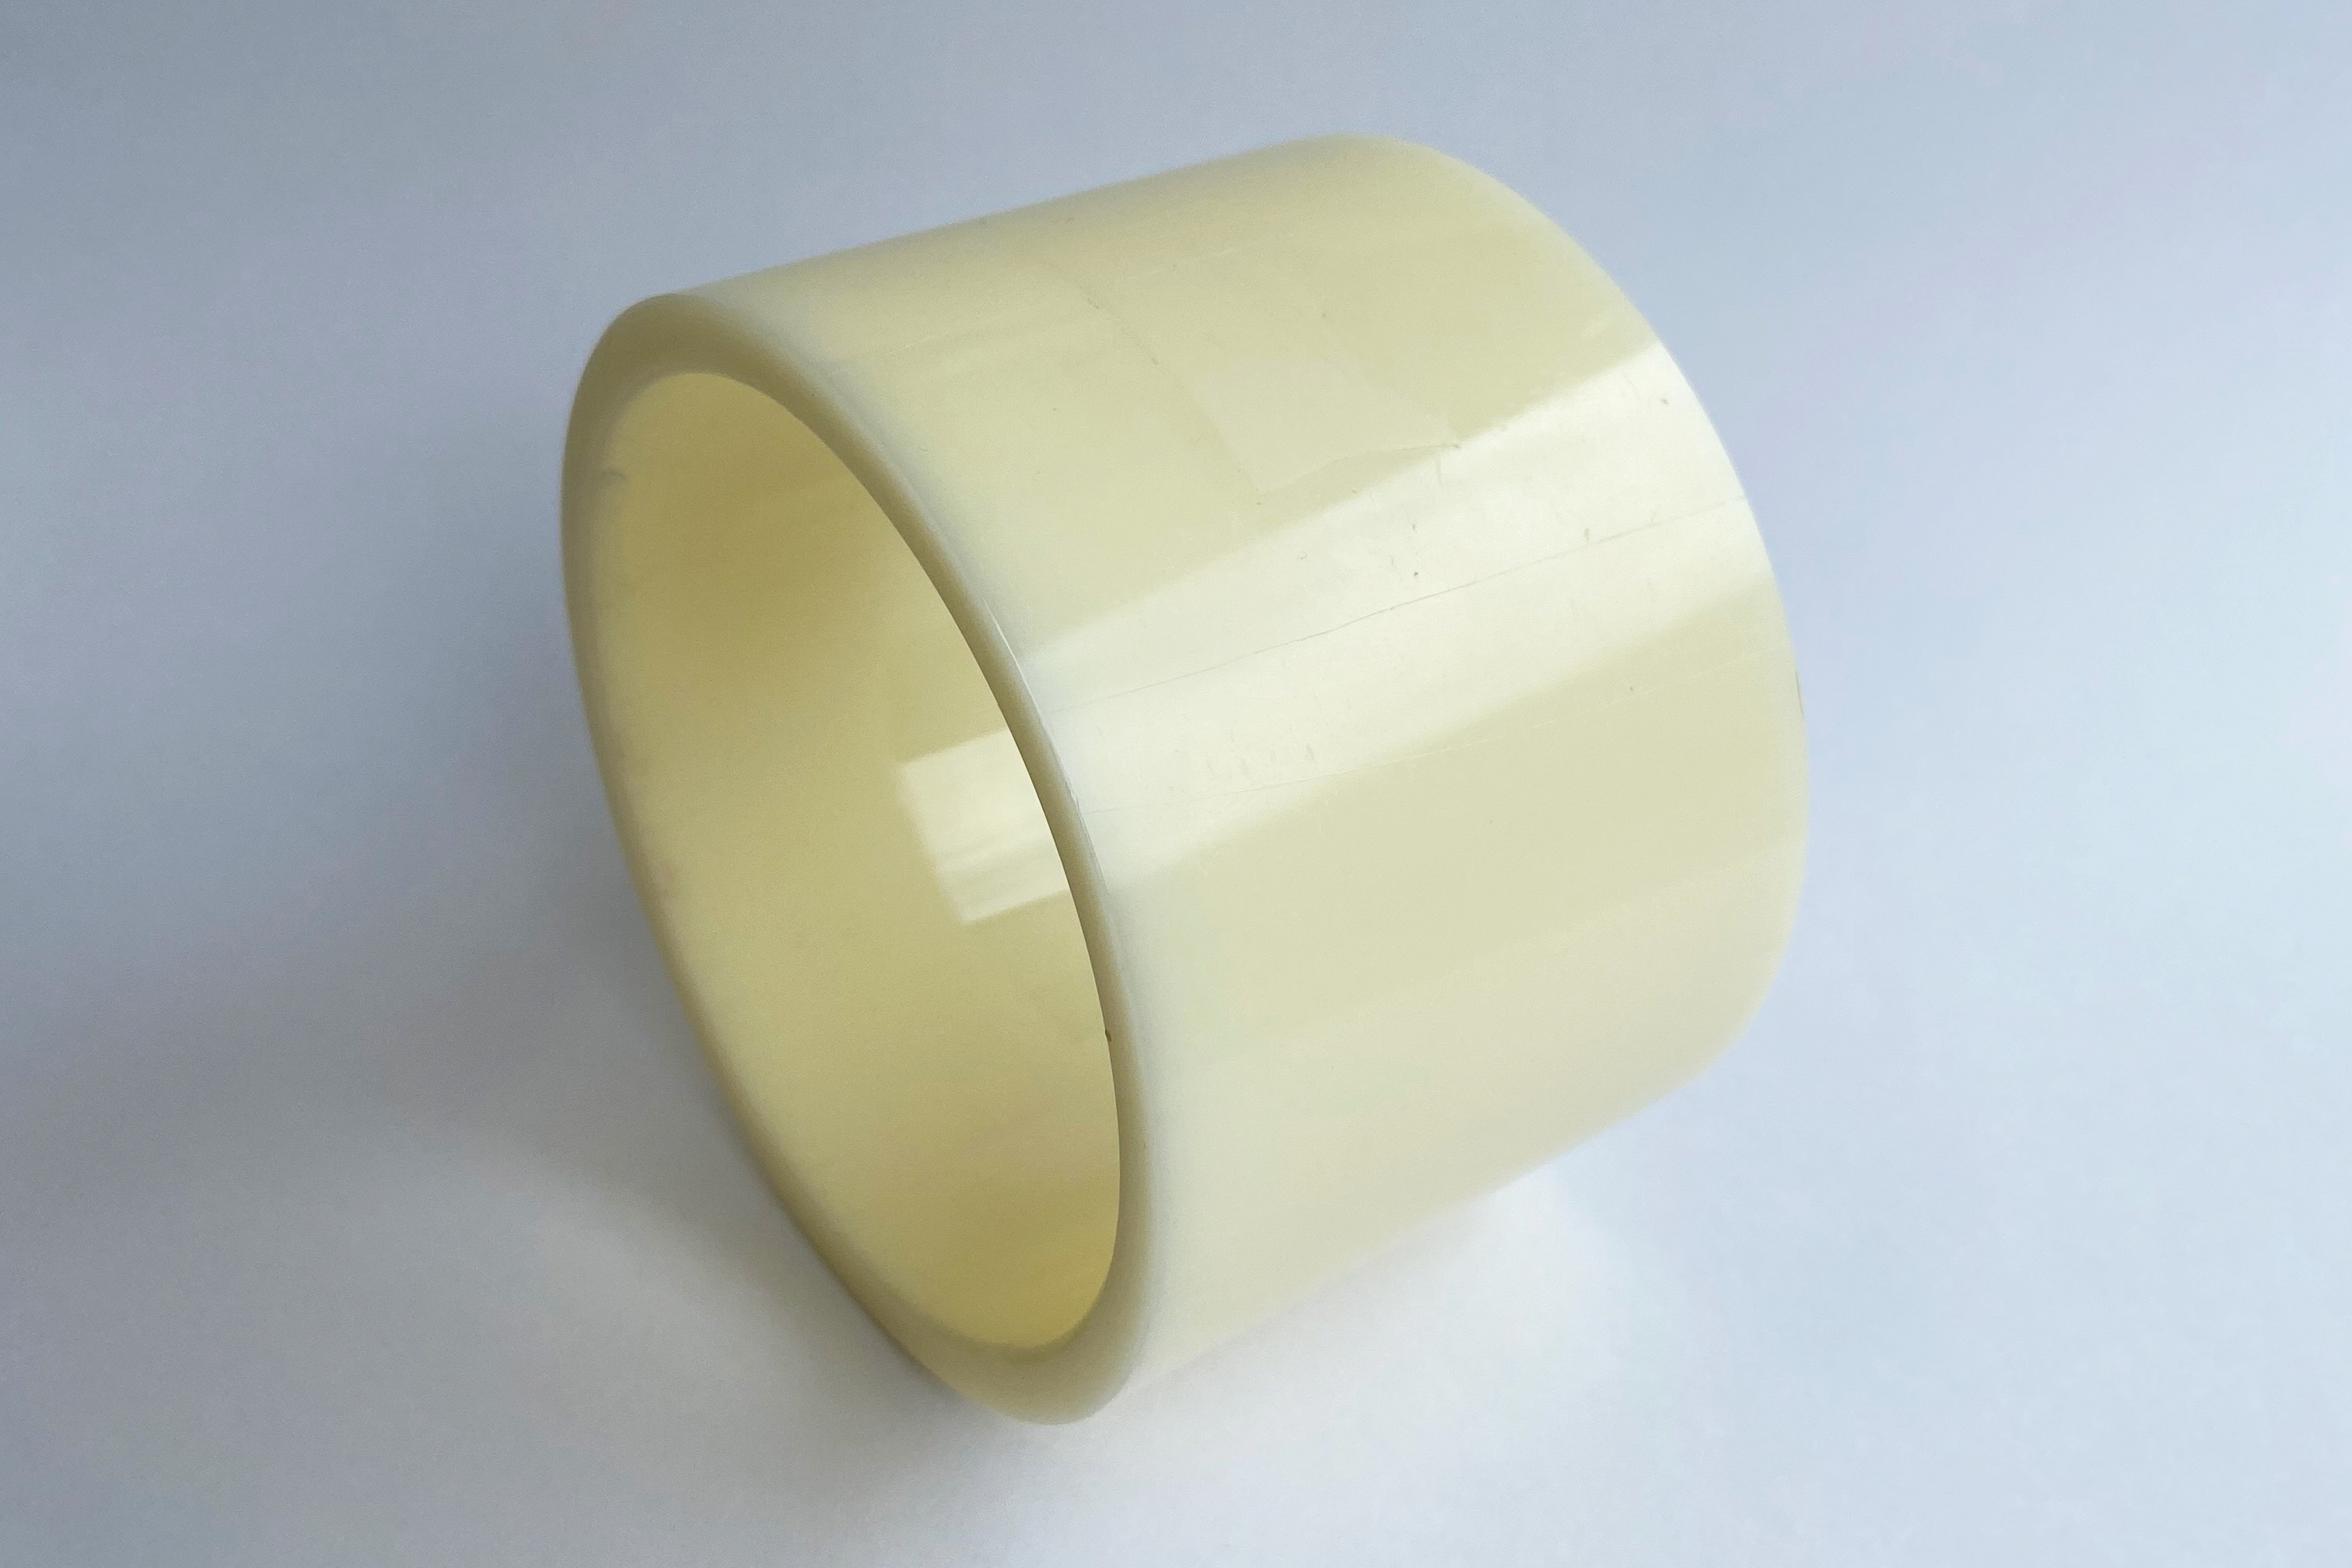
Each year, Pigeon Manufacturing Hyogo Corporation returns around 350 kg of these roll-shaped cores to the raw-material manufacturer for reuse.
Pollution Prevention
To reduce the amount of non-reusable industrial waste from business activities, the Pigeon Group has set a target of reducing industrial waste volume intensity by 1% per year. In production facilities, in addition to improving productivity and yield rate, the Group is making concerted efforts to prevent pollution, such as by eliminating waste incinerators. The Pigeon Group is also reassessing its waste-treatment contractors, to enable recycling of industrial waste that was treated without recycling previously.
Boundary: All Pigeon sites covering manufacturing sites, sales and service facilities (excludes Pigeon (Shanghai) Co., Ltd. and the Pigeon Osaka Branch, sites coverage 93.9%)
※ Calculations do not include general business waste or waste that is recycled (such as through thermal recycling)
※ Calculations for domestic operations for December 2019 are based on the 11-month period from February 1 to December 31, 2019 (due to a change in the fiscal year-end).
※ There was an error in past data, and the figures have been corrected.
Total Amount of Waste Generated
Unit: ton
|
Jan.2018 |
Dec.2019 |
Dec.2020*¹ |
||
|---|---|---|---|---|
|
Pigeon Group Total |
Total Amount of Waste Generated*1 |
3,902 |
3,660 |
3,799 |
|
Amount of Waste Reused or Recycled*2 |
2,856 |
2,694 |
3,278 |
|
|
Reuse and Recycle Rate (%)*2 |
73.2% |
73.6% |
86.3% |
|
|
Amount of Industrial Waste*3 |
1,047 |
967 |
520 |
|
|
Intensity of Industrial Waste (kg-CO2/¥Million JPY) |
10.0 | 9.7 | 5.2 | |
|
Of which, Amount of Hazardous Waste*⁴ |
19 |
15 | 17 |
Boundary: All Pigeon sites covering manufacturing sites, sales and service facilities (excludes Pigeon (Shanghai) Co., Ltd. and the Pigeon Osaka Branch)
*1 Amount of waste generated (93.9%)
*2 Reuse and recycle amount and ratio (2018 30.9%, 2019, 30.9%, 2020 93.9%) , sales & Services sites caluculated from 2020
*3 Amount of industrial waste (93.9%) , refers to portion of generated waste not reused nor recycled
*4 Hazoudous Waste (30.0%), the amount is calculated for 3 of the ten manufacturing sites
The figures in parentheses()indicates sites coverage ratio